
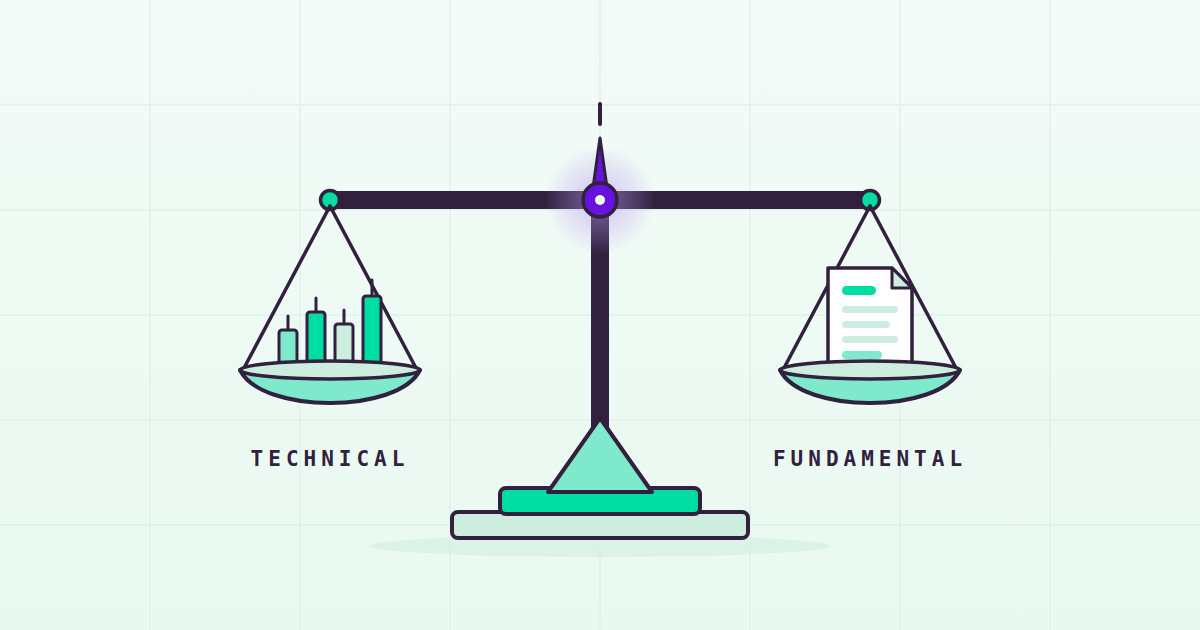
Technical Analysis vs. Fundamental Analysis: Two Different Questions
Technical analysis vs fundamental analysis is one of the longest-running arguments in markets, and most articles about it quietly pick a side. We’re going to skip the argument entirely – because the two approaches aren’t answering the same question. Fundamental analysis asks: what is this business actually worth? Technical analysis asks: what has price been doing, and what are the other participants in this market likely watching?
Different questions. Neither approach answers the other’s, and neither is a shortcut to being right.
So this article won’t crown a winner. Both approaches get defined precisely, implemented concretely, and given their honest pros and cons – the real ones, not the strawman versions each camp likes to use against the other. There’s a quick-reference table near the end if you just want the summary.
What Is Technical Analysis?
Technical analysis is the study of price and volume data to describe market behavior.
That definition sounds modest, and the modesty is the point. A price chart is a record of what every buyer and seller actually did – not what they said, not what they hoped, what they did. Technical analysis takes that record and organizes it: where has buying reliably shown up? Where do rallies keep stalling? Is the trend steady, or getting shakier as it goes?
Here’s the part both fans and critics tend to miss: every technical indicator is a transformation of data already on the chart. A moving average, an oscillator, a volatility band – each one is arithmetic applied to the same prices and volumes you were already looking at. Indicators add clarity, not information. They can make a trend easier to see; they cannot see something that isn’t in the price history. Understood that way, technical analysis is less a crystal ball and more a well-organized lens.
We’ve written a full guide to technical indicators and a deep dive on support and resistance if you want the detail behind what follows.
How Can You Implement Technical Analysis?
You need three things: a chart, a timeframe, and a small set of indicators you genuinely understand.
The timeframe comes first, because every indicator is computed per “period,” and a period can be a minute, an hour, a day, or a week. The math is identical – only the horizon changes. A day trader and a position trader can use the exact same indicator and be looking at completely different worlds.
The indicators themselves cluster into four families:
- Trend indicators smooth price to show direction. The simple moving average (SMA) is the arithmetic mean of the last N closing prices. The exponential moving average (EMA) is a weighted average that gives more weight to recent prices, so it responds faster when the trend changes.
- Momentum indicators measure the speed of a move. RSI is a momentum oscillator bounded between 0 and 100, commonly calculated over 14 periods; readings above 70 are conventionally called “overbought” and readings below 30 “oversold” – conventions, not rules. MACD subtracts the 26-period EMA from the 12-period EMA, then pairs the result with a 9-period EMA signal line.
- Volatility indicators measure how much price moves, regardless of direction. The standard shortcut: annualized volatility equals daily volatility multiplied by the square root of 252, the conventional count of trading days in a year. We walk through the full calculation in how to calculate volatility.
- Volume indicators ask how much participation was behind a move. The same price change on heavy volume and on light volume are two different events, and volume is the one column on the chart that isn’t price.
Chartists also mark horizontal levels where price has repeatedly turned – support below, resistance above. Part of why levels matter is reflexive: when enough participants watch the same level, the level itself becomes part of market behavior. Some traders add Fibonacci retracement levels at 23.6%, 38.2%, 50%, 61.8%, and 78.6% (a small nerd note: 50% is not actually a Fibonacci ratio – it’s included by convention).
That’s genuinely most of the toolkit. The craft is in using a few tools consistently rather than all of them at once – more on that in the cons.
Pros of Technical Analysis
- It applies to anything with a price history. A stock, an ETF, a currency pair, a commodity, a crypto asset – if it trades, you can chart it. And for assets with no underlying business (there is no 10-K for a currency pair), technical analysis is the only one of these two approaches that applies at all.
- It works across timeframes, including very short ones. The same toolkit scales from one-minute bars to weekly bars. A fundamental thesis rarely resolves in an afternoon; a chart updates with every trade.
- It’s explicit about levels, which makes it explicit about risk. “This idea is wrong if price falls below this level” is a concrete, testable statement. Whatever you think of any particular level, deciding in advance where you’re wrong is real risk discipline, and technical analysis has it built in.
- It’s fast and cheap to compute. A moving average over decades of daily closes runs in milliseconds, which means an idea can be checked across thousands of symbols before any money is at stake.
Cons of Technical Analysis
- Indicators lag, because they have to. Every indicator is computed from past prices, so it describes what has happened rather than predicting what will. A moving average turns up after the trend does. That’s not a flaw in the formula – it’s the nature of the input.
- Levels and parameters are subjective. Why 14 periods for RSI rather than 10? Why draw the trendline from this low and not that one? Two careful chartists can mark different levels on the same chart, and neither is provably wrong.
- It’s easy to overfit. Price history has exactly one path, and with enough parameters you can find a rule that fits that path beautifully… and then falls apart out of sample. A rule tuned to history has memorized, not learned.
- Stacking indicators can be one signal counted several times. RSI and MACD are both computed from the same closing prices. When they agree, that often isn’t independent confirmation – it’s correlation wearing two costumes. Five derived views of one price series are still one price series.
What Is Fundamental Analysis?
Fundamental analysis is the work of estimating what a business is actually worth, from its financial statements and the economics underneath them.
The premise: a share of stock is a fractional claim on a real company – its revenues, its costs, its assets, its debts – not a squiggle on a chart. If you can estimate what the whole business is worth, you can compare that estimate to the market price. Sometimes the two agree. Sometimes they don’t, and that gap between price and estimated value is where fundamental investors go to work.
Notice the question being answered. Not “where is price going next week?” but “what am I buying, and what is it worth?” Price only enters at the very end, as the thing your estimate gets compared against.
How Can You Implement Fundamental Analysis?
Start with the three financial statements:
- The income statement – what the company earned and spent over a period, ending in profit or loss.
- The balance sheet – a snapshot of what the company owns and owes, held together by a single identity: assets = liabilities + shareholders’ equity. It has to balance. (It’s in the name.)
- The cash flow statement – the cash that actually moved in and out of the business, which is a different picture from accounting profit.
The primary sources are the filings themselves, and they’re free. US-listed companies file a 10-K every year (annual, audited), a 10-Q every quarter (quarterly, unaudited), and an 8-K whenever something material happens in between – all public on the SEC’s EDGAR database.
From the statements, analysts compute ratios that make businesses comparable:
- Earnings per share (EPS): net income available to common shareholders divided by the weighted average shares outstanding.
- Price-to-earnings (P/E): share price divided by earnings per share.
- Price-to-book (P/B): share price divided by book value per share.
- Return on equity (ROE): net income divided by shareholders’ equity.
- Free cash flow: operating cash flow minus capital expenditures.
You’ll notice we haven’t said what a “good” P/E or ROE is. That’s deliberate. Ratios only mean something compared across time, across peers, and against the economics of the specific industry. Context in markets is everything – the formulas are the easy part, and the interpretation is the craft.
Pros of Fundamental Analysis
- It tells you what you actually own. After real fundamental work, you can describe the business behind the ticker – how it makes money, what it owns, what it owes. That understanding exists whether the market is open or closed.
- It grounds a view in cash flows and assets rather than sentiment. An estimate of value built from statements can be argued with, checked, and revised. It doesn’t move because a chart looked scary this morning.
- It suits longer horizons. Businesses change on the scale of quarters and years, and the analysis inherits that rhythm. If the intended holding period is long, the tool matches the job.
- It gives you a reason to hold when price moves against you. If the thesis is about the business and the business hasn’t changed, a falling price is information to weigh rather than an automatic verdict. (Whether the thesis was right is a separate question – see the cons.)
Cons of Fundamental Analysis
- It says very little about timing. This is the big one. A company can trade below your estimate of its worth for years. Valuation tells you what you think something is worth; it does not tell you when – or whether – the market will come around to agreeing.
- Accounting choices differ between firms. Two companies in the same industry can make different, entirely legal accounting choices – revenue recognition, depreciation schedules, what gets capitalized – which makes clean comparison real work rather than a spreadsheet formality.
- Figures get restated. The numbers you analyzed can be revised after the fact. An analysis is only as sturdy as the statements underneath it, and statements are not carved in stone.
- Some value hides from the statements. When a company’s worth sits in brand, network effects, or research still in progress, the statements capture it badly, and statement-driven analysis struggles with it.
- It doesn’t apply everywhere. A currency pair has no income statement. A commodity has no management team. Where there is no underlying business, there are no fundamentals to analyze – which is exactly where technical analysis becomes the only one of the two still standing.
Technical Analysis vs Fundamental Analysis: A Quick Reference Summary
Here’s the whole article in one table. Short cells on purpose – the nuance lives in the sections above.
| Technical analysis | Fundamental analysis | |
|---|---|---|
| Question it answers | What has price been doing, and what are other participants likely watching? | What is this business actually worth? |
| Primary inputs | Price and volume history | Financial statements (10-K, 10-Q, 8-K), ratios, business economics |
| Typical time horizon | Minutes to months | Quarters to years |
| Main strength | Explicit levels for entries, exits, and risk; applies to anything with a price history | Grounds a view in cash flows and assets; tells you what you own |
| Main limitation | Derived from past prices, so it describes rather than predicts | Says little about timing; a stock can stay cheap for years |
Using Technical and Fundamental Analysis Together
Because the two approaches answer different questions, they don’t compete for the same job – which is exactly why some investors run them together.
The cleanest division of labor: fundamentals to work out what might be worth owning and at roughly what price, technicals to think about when and to define risk. The fundamental work builds a shortlist and a sense of value; the technical work watches how price behaves around levels and keeps the “this idea is wrong if…” line explicit. One approach supplies the thesis, the other supplies the timing and the discipline. Neither could do the other’s job.
Two honest caveats. First, plenty of successful investors use only one – long-horizon investors who never open a chart, short-term traders who never open a 10-K – and both can be entirely reasonable given their holding periods. Second, combining them is not automatically better. Using both answers more questions; it doesn’t answer any single question more correctly. If the extra question isn’t one your process needs answered, the extra tool is just weight.
The Bottom Line (and the Data Underneath)
Technical analysis describes what price has been doing. Fundamental analysis estimates what a business is worth. Both are real crafts with real limits, and the argument between them mostly dissolves once you notice they’re answering different questions.
Both of them run on data, though – and any analysis is only as good as the data underneath it. Technical work needs clean price history, adjusted for splits and dividends (an unadjusted chart will happily show a “crash” that was just a 2-for-1 split). Fundamental work additionally needs statements that are consistent across companies and across time – ideally point-in-time, so you see what was actually known on a given date rather than what got restated later.
That data layer is the part we obsess over at Tiingo. Since 2014 we’ve been making high-end market data accessible to everyone: end-of-day prices that are split- and dividend-adjusted and error-checked, with history back to 1962 and coverage across 80,000+ assets, plus a fundamental data add-on with 20+ years of statement history. The free plan is $0 and includes 30+ years of price history, because we don’t believe in holding good data hostage. Whichever question you decide to ask – what is it worth, or what has price been doing – we’d love to hand you the data to answer it.